1. Tổng quan.
Prometheus được dùng để giám sát hệ thống thông qua các daemon cài sẵn trên các node, qua đó thu thập các thông tin cần thiết. Prometheus giao tiếp với node qua giao thức HTTP/https và lưu trữ data theo dạng time-series database (TSDB). Phần này mình sẽ sử dụng ví dụ bài trước để đẩy các metric sử dụng Telegraf đẩy về Prometheus nhé.

2. Cách cấu hình trên Telegraf.
Bạn có thể cấu hình Telegraf để xuất dữ liệu sang Prometheus bằng cách sử dụng plugin [[outputs.prometheus_client]]. Dưới đây là cách bạn có thể thêm cấu hình này vào file cấu hình Telegraf của bạn.
Thêm đoạn cấu hình sau vào file cấu hình Telegraf của bạn:
[[outputs.prometheus_client]]
  listen = ":9273"
  path = "/metrics"
  expiration_interval = "60s"
  collectors_exclude = ["gocollector", "process"]
Trong đó.
listen: Địa chỉ và cổng mà Prometheus sẽ sử dụng để thu thập dữ liệu từ Telegraf. Trong ví dụ này, Telegraf sẽ lắng nghe trên cổng 9273.path: Đường dẫn mà Prometheus sẽ sử dụng để thu thập dữ liệu. Mặc định là/metrics.expiration_interval: Thời gian mà các số liệu sẽ hết hạn nếu không được cập nhật.collectors_exclude: Danh sách các collector của Prometheus mà bạn muốn loại trừ.
Cấu hình đầy đủ của bạn sau khi thêm output Prometheus.
[global_tags]
[agent]
  interval = "60s"
  round_interval = true
  metric_batch_size = 5000
  metric_buffer_limit = 100000
  collection_jitter = "0s"
  flush_interval = "60s"
  flush_jitter = "0s"
  precision = ""
  debug = true
  quiet = false
  logfile = "/var/log/telegraf/telegraf.log"
  hostname = ""
  omit_hostname = false

[[outputs.influxdb]]
   urls = ["http://127.0.0.1:8086"]
   timeout = "60s"
   database = "database-name"
   tagexclude = ["hash", "last_update", "status_changed_at", "put_timestamp", "reported_put_timestamp"]
   namedrop = ["*-scanner"]

[[outputs.prometheus_client]]
  listen = ":9273"
  path = "/metrics"
  expiration_interval = "60s"
  collectors_exclude = ["gocollector", "process"]

[[inputs.cpu]]
  percpu = true
  totalcpu = true
  collect_cpu_time = false
  report_active = false

[[inputs.diskio]]
[[inputs.kernel]]
[[inputs.mem]]
[[inputs.processes]]
[[inputs.system]]
[[inputs.net]]
[[inputs.netstat]]
[[inputs.nstat]]
[[inputs.interrupts]]
[[inputs.linux_sysctl_fs]]
Bằng cách thêm cấu hình [[outputs.prometheus_client]], bạn có thể xuất dữ liệu từ Telegraf sang Prometheus.
Sau khi cấu hình, khởi động lại Telegraf.
systemctl restart telegrafCheck trạng thái Telegraf.
shell> systemctl status telegraf
● telegraf.service - Telegraf
     Loaded: loaded (/lib/systemd/system/telegraf.service; enabled; vendor preset: enabled)
     Active: active (running) since Thu 2024-09-12 10:19:14 UTC; 31s ago
       Docs: https://github.com/influxdata/telegraf
   Main PID: 61208 (telegraf)
      Tasks: 9 (limit: 9389)
     Memory: 150.7M
        CPU: 2.319s
     CGroup: /system.slice/telegraf.service
             └─61208 /usr/bin/telegraf -config /etc/telegraf/telegraf.conf -config-directory /etc/telegraf/telegraf.d

Sep 12 10:19:09 ubuntu2204 systemd[1]: Starting Telegraf...
Sep 12 10:19:14 ubuntu2204 telegraf[61208]: 2024-09-12T10:19:14Z I! Loading config: /etc/telegraf/telegraf.conf
Sep 12 10:19:14 ubuntu2204 telegraf[61208]: 2024-09-12T10:19:14Z I! Loading config: /etc/telegraf/telegraf.d/layer34.conf
Sep 12 10:19:14 ubuntu2204 systemd[1]: Started Telegraf.
Bạn có thể check log của Telegraf tại /var/log/telegraf/telegraf.log, nhìn log bạn có thể thấy Telegraf đã đẩy log sử dụng output của Prometheus rồi.
shell> tail -f /var/log/telegraf/telegraf.log
2024-09-12T10:19:14Z I! [agent] Config: Interval:1m0s, Quiet:false, Hostname:"ubuntu2204", Flush Interval:1m0s
2024-09-12T10:19:14Z D! [agent] Initializing plugins
2024-09-12T10:19:14Z W! DeprecationWarning: Value "false" for option "ignore_protocol_stats" of plugin "inputs.net" deprecated since version 1.27.3 and will be removed in 1.36.0: use the 'inputs.nstat' plugin instead for protocol stats
2024-09-12T10:19:14Z D! [agent] Connecting outputs
2024-09-12T10:19:14Z D! [agent] Attempting connection to [outputs.influxdb]
2024-09-12T10:19:14Z D! [agent] Successfully connected to outputs.influxdb
2024-09-12T10:19:14Z D! [agent] Attempting connection to [outputs.prometheus_client]
2024-09-12T10:19:14Z I! [outputs.prometheus_client] Listening on http://[::]:9273/metrics
2024-09-12T10:19:14Z D! [agent] Successfully connected to outputs.prometheus_client
2024-09-12T10:19:14Z D! [agent] Starting service inputs
2024-09-12T10:20:14Z D! [outputs.prometheus_client] Wrote batch of 123 metrics in 3.61388ms
2024-09-12T10:20:14Z D! [outputs.prometheus_client] Buffer fullness: 0 / 100000 metrics
2024-09-12T10:20:14Z D! [outputs.influxdb] Wrote batch of 123 metrics in 7.028024ms
2024-09-12T10:20:14Z D! [outputs.influxdb] Buffer fullness: 0 / 100000 metrics
Hãy cấu hình phần tiếp theo để kiểm tra xem Prometheus có thể thu thập dữ liệu từ Telegraf qua cổng và đường dẫn đã cấu hình hay không.
3. Cách cấu hình trên Prometheus.
Giả sử bạn đã có 1 con Prometheus, do mình đã hướng dẫn cài đặt Prometheus nhiều rồi nên mình không muốn hướng lại nữa mà bước qua phần cấu hình Prometheus để thu thập dữ liệu từ Telegraf.
Mở file cấu hình của Prometheus (prometheus.yml) và thêm một job mới trong phần scrape_configs để thu thập dữ liệu từ Telegraf.
Dưới đây là một ví dụ về cấu hình Prometheus:
global:
  scrape_interval: 15s

scrape_configs:
  - job_name: 'telegraf'
    static_configs:
      - targets: ['localhost:9273']
Trong đó:
job_name: Tên của job, bạn có thể đặt tên bất kỳ, ví dụ:telegraf.static_configs: Phần này để bạn cấu hình các target.targets: Danh sách các endpoint mà Prometheus sẽ thu thập dữ liệu. Trong ví dụ này, Telegraf đang lắng nghe trênlocalhostcổng9273.
Ví dụ.
global:
  scrape_interval:     15s
  evaluation_interval: 15s

scrape_configs:
  - job_name: 'prometheus'
    static_configs:
      - targets: ['localhost:9090']

  - job_name: 'pushgateway'
    static_configs:
      - targets: ['pushgateway:9091']

  - job_name: 'telegraf'
    static_configs:
      - targets: ['10.237.7.71:9273']
Khởi động lại Prometheus
Sau khi chỉnh sửa file cấu hình, khởi động lại Prometheus để áp dụng các thay đổi. Nếu sử dụng container thì bạn khởi động lại container Prometheus.
4. Kiểm tra Endpoint trên diện Prometheus.
Mở giao diện web của Prometheus (thường là http://10.237.7.71:9090) và đi tới phần Status > Targets để kiểm tra xem Prometheus đã thu thập dữ liệu từ Telegraf hay chưa.
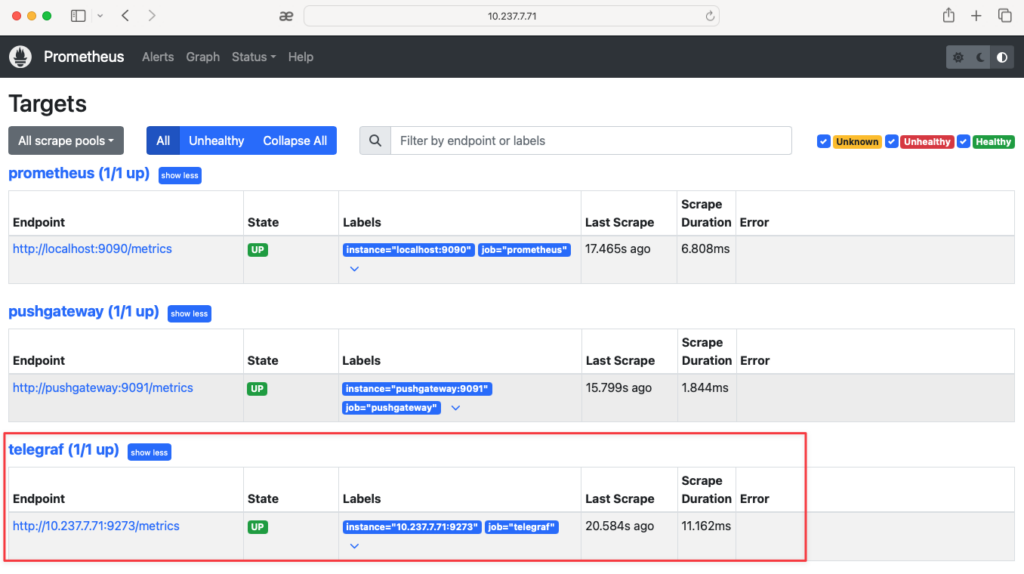
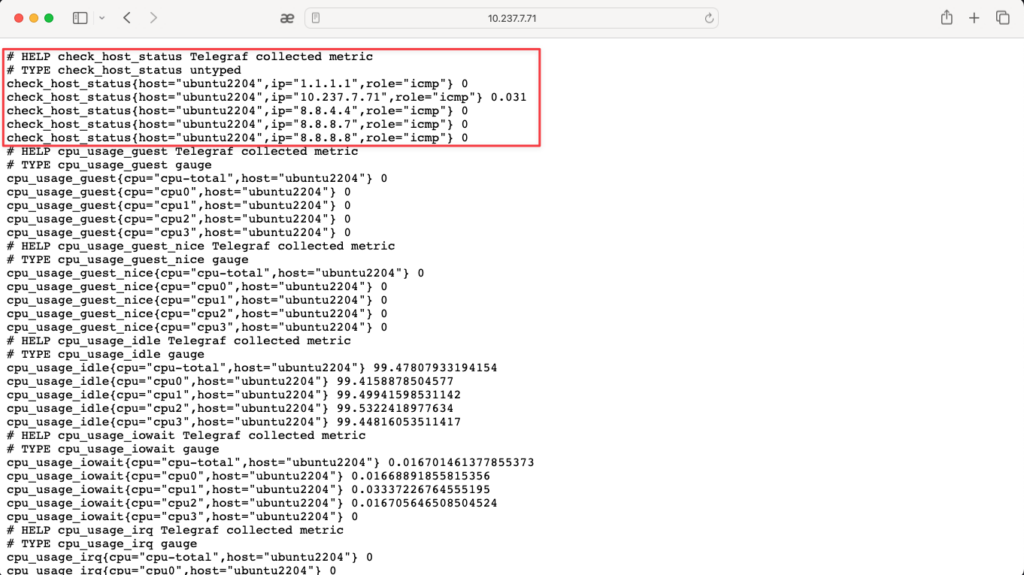
Kết quả khi truy cập vào Endpoint bạn sẽ thấy cả metrics của mình tự tạo ở bài trước.
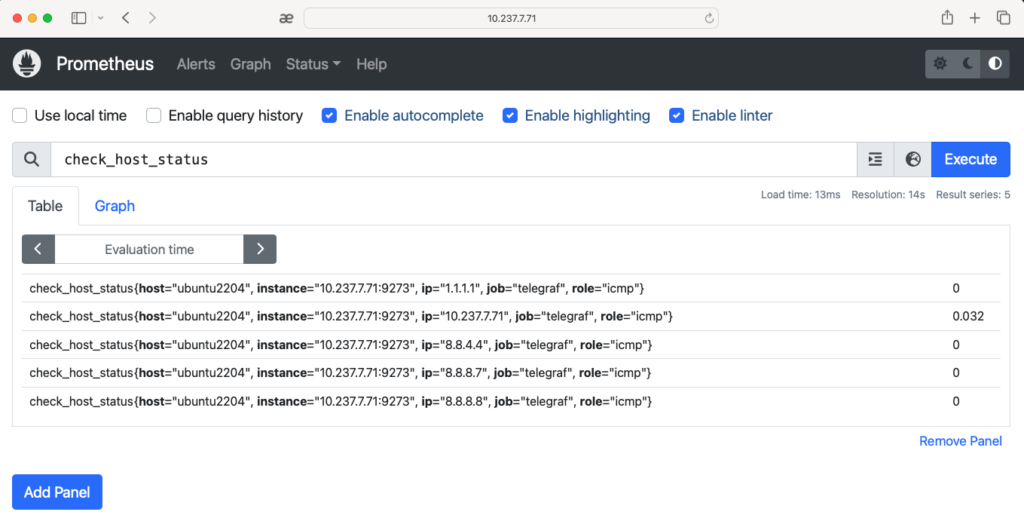
Và đây là kết quả truy vấn.
5. Tổng kết.
Bằng cách thêm cấu hình trên vào file prometheus.yml, Prometheus sẽ bắt đầu thu thập dữ liệu từ endpoint của Telegraf. Điều này giúp bạn giám sát và phân tích dữ liệu một cách trực quan và hiệu quả.