1. Tổng quan.
Khi quản lý nhiều cụm Ceph trong một hạ tầng lớn, việc giám sát các metrics trở nên phức tạp do dữ liệu từ nhiều cụm được đẩy về cùng một hệ thống Prometheus. Nếu không có cách phân biệt rõ ràng, việc truy vấn hoặc thiết lập cảnh báo có thể trở nên rối rắm.
Một giải pháp hiệu quả là gắn thêm nhãn (label) cluster=<cluster_name> vào các metrics. Điều này giúp phân tách dữ liệu giữa các cụm Ceph, cho phép truy vấn dễ dàng hơn và hỗ trợ việc theo dõi hiệu suất từng cụm một cách trực quan.
2. Quy trình triển khai.
Bước 1: Chỉnh sửa file prometheus.yml trên node chạy Prometheus
Ceph Orchestrator không hỗ trợ thêm label vào metric bằng Service Spec. Để làm điều đó, bạn cần chỉnh sửa trực tiếp cấu hình Prometheus sau khi service đã được deploy.
Tìm file prometheus.yml trên node CEPH-LAB-MONITORING-077 (hoặc node khác đang chạy Prometheus). Vị trí file có thể là:
/var/lib/ceph/<fsid>/prometheus/prometheus.ymlMở file này và thêm vào metric_relabel_configs:
scrape_configs:
  - job_name: "ceph"
    static_configs:
      - targets: ["<ceph-mgr-ip>:9283"]
    metric_relabel_configs:
      - target_label: "cluster"
        replacement: "CLUSTER_LAB"
Ví dụ.
global:
  scrape_interval: 10s
  evaluation_interval: 10s
rule_files:
  - /etc/prometheus/alerting/*

alerting:
  alertmanagers:
    - scheme: http
      http_sd_configs:
        - url: http://10.237.7.71:8765/sd/prometheus/sd-config?service=alertmanager

scrape_configs:
  - job_name: 'ceph'
    honor_labels: true
    http_sd_configs:
    - url: http://10.237.7.71:8765/sd/prometheus/sd-config?service=mgr-prometheus
    metric_relabel_configs:
      - target_label: "cluster"
        replacement: "CLUSTER_LAB"

  - job_name: 'node'
    http_sd_configs:
    - url: http://10.237.7.71:8765/sd/prometheus/sd-config?service=node-exporter
    metric_relabel_configs:
      - target_label: "cluster"
        replacement: "CLUSTER_LAB"

  - job_name: 'ceph-exporter'
    honor_labels: true
    http_sd_configs:
    - url: http://10.237.7.71:8765/sd/prometheus/sd-config?service=ceph-exporter
    metric_relabel_configs:
      - target_label: "cluster"
        replacement: "CLUSTER_LAB"

  - job_name: 'nvmeof'
    http_sd_configs:
    - url: http://10.237.7.71:8765/sd/prometheus/sd-config?service=nvmeof
    metric_relabel_configs:
      - target_label: "cluster"
        replacement: "CLUSTER_LAB"
Bước 2: Restart Prometheus
Sau khi sửa xong, bạn cần restart Prometheus để áp dụng thay đổi:
shell> ceph orch restart prometheus
Scheduled to restart prometheus.CEPH-LAB-MONITORING-077 on host 'CEPH-LAB-MONITORING-077'
Scheduled to restart prometheus.CEPH-LAB-MONITORING-078 on host 'CEPH-LAB-MONITORING-078'
Lưu ý là bạn phải restart Prometheus bằng cách này, nếu bạn restart container theo cách thủ công, mình thấy không áp dụng được config mới.
shell> ceph orch ps | grep prometheus
prometheus.CEPH-LAB-MONITORING-077     CEPH-LAB-MONITORING-077  *:9191            running (16s)    14s ago  19h    51.5M        -  2.43.0   a07b618ecd1d  c49646070232
prometheus.CEPH-LAB-MONITORING-078     CEPH-LAB-MONITORING-078  *:9191            running (21s)    19s ago  19h    52.0M        -  2.43.0   a07b618ecd1d  96b6bfc8e86e
Xem container bạn cũng sẽ thấy container đã được restart, ảnh hưởng bởi lệnh ceph orch restart prometheus
shell> podman ps
CONTAINER ID IMAGE COMMAND CREATED STATUS PORTS NAMES
00981b1627df quay.io/prometheus/node-exporter:v1.5.0 --no-collector.ti... 20 hours ago Up 20 hours ago ceph-2263ee00-feeb-11ef-87cf-830f63d4fcbe-node-exporter-CEPH-LAB-MONITORING-078
2c0132ea4dc3 quay.io/ceph/ceph@sha256:6ac7f923aa1d23b43248ce0ddec7e1388855ee3d00813b52c3172b0b23b37906 -n client.crash.C... 20 hours ago Up 20 hours ago ceph-2263ee00-feeb-11ef-87cf-830f63d4fcbe-crash-CEPH-LAB-MONITORING-078
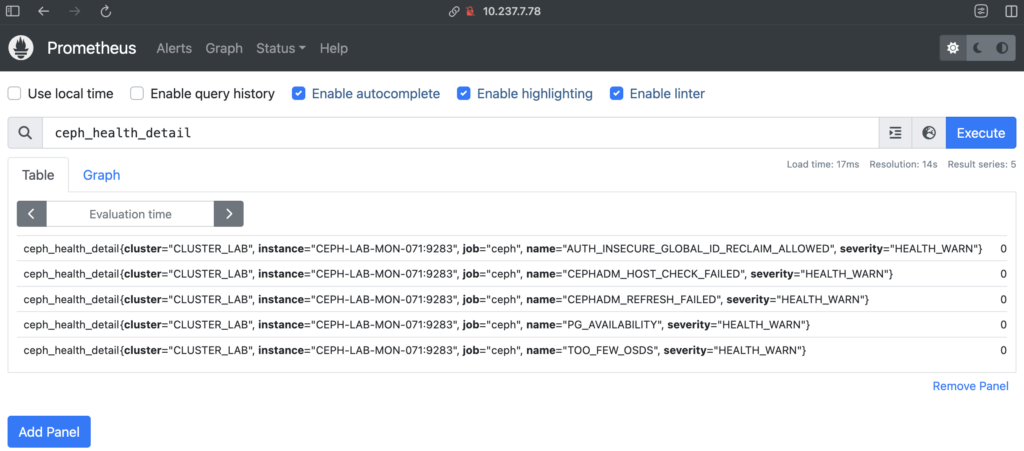
96b6bfc8e86e quay.io/prometheus/prometheus:v2.43.0 --config.file=/et... 43 seconds ago Up 44 seconds ago ceph-2263ee00-feeb-11ef-87cf-830f63d4fcbe-prometheus-CEPH-LAB-MONITORING-078Thử query bạn có kết quả các metrics đã được gắn thêm lable cluster=<cluster_name> điều này sẽ giúp bạn dễ query hơn khi có quá nhiều cụm Ceph.
shell> curl -G 'http://10.237.7.78:9191/api/v1/query' --data-urlencode 'query=ceph_health_detail' | jq
  % Total    % Received % Xferd  Average Speed   Time    Time     Time  Current
                                 Dload  Upload   Total   Spent    Left  Speed
100  1080  100  1080    0     0   461k      0 --:--:-- --:--:-- --:--:--  527k
{
  "status": "success",
  "data": {
    "resultType": "vector",
    "result": [
      {
        "metric": {
          "__name__": "ceph_health_detail",
          "cluster": "CLUSTER_LAB",
          "instance": "CEPH-LAB-MON-071:9283",
          "job": "ceph",
          "name": "AUTH_INSECURE_GLOBAL_ID_RECLAIM_ALLOWED",
          "severity": "HEALTH_WARN"
        },
        "value": [
          1741835932.364,
          "0"
        ]
      },
      {
        "metric": {
          "__name__": "ceph_health_detail",
          "cluster": "CLUSTER_LAB",
          "instance": "CEPH-LAB-MON-071:9283",
          "job": "ceph",
          "name": "CEPHADM_HOST_CHECK_FAILED",
          "severity": "HEALTH_WARN"
        },
        "value": [
          1741835932.364,
          "0"
        ]
      },
      {
        "metric": {
          "__name__": "ceph_health_detail",
          "cluster": "CLUSTER_LAB",
          "instance": "CEPH-LAB-MON-071:9283",
          "job": "ceph",
          "name": "CEPHADM_REFRESH_FAILED",
          "severity": "HEALTH_WARN"
        },
        "value": [
          1741835932.364,
          "0"
        ]
      },
      {
        "metric": {
          "__name__": "ceph_health_detail",
          "cluster": "CLUSTER_LAB",
          "instance": "CEPH-LAB-MON-071:9283",
          "job": "ceph",
          "name": "PG_AVAILABILITY",
          "severity": "HEALTH_WARN"
        },
        "value": [
          1741835932.364,
          "0"
        ]
      },
      {
        "metric": {
          "__name__": "ceph_health_detail",
          "cluster": "CLUSTER_LAB",
          "instance": "CEPH-LAB-MON-071:9283",
          "job": "ceph",
          "name": "TOO_FEW_OSDS",
          "severity": "HEALTH_WARN"
        },
        "value": [
          1741835932.364,
          "0"
        ]
      }
    ]
  }
}
Bạn cũng có thể query bằng GUI.
Hãy lưu ý điều dưới đây trong quy trình triển khai nhé.
- ❌ Không thể thêm label vào file Spec (
ceph orch apply -i prometheus.yml) - ✅ Cách đúng: Chỉnh sửa
prometheus.ymltrên node chạy Prometheus. - ✅ Cách tốt nhất: Dùng
metric_relabel_configsđể thêmcluster="CLUSTER_LAB".
3. Kết luận
Bằng cách gán nhãn cluster_name, bạn có thể tổ chức và truy vấn dữ liệu Prometheus một cách hiệu quả, tránh nhầm lẫn khi có nhiều cụm Ceph. Ngoài ra, điều này giúp tối ưu việc cấu hình dashboard trên Grafana cũng như thiết lập cảnh báo phù hợp với từng cụm.